Lohit Balakumar
George Mason University Advanced Materials and Manufacturing Lab
My time at the Advanced Materials and Manufacturing Lab at George Mason University was spent working with slip resistant footwear against ice. The project I worked on can be found here.
Background
The background behind this project was preventing fatal injuries due to slipping on ice in the agricultural, forestry, fishing and hunting (AFFH) industries. The lab had previously developed and patented a novel composite for boot outsoles consisting of thermoplastic polyurethane (TPU), zylon (PBO), and carbon fiber (CF) (Bagheri, 2019). While it proved to be very slip resistant, it wore out very quickly. The goal of this project was to find the most optimal tread design for the highest coefficient of friction.

Plug Fabrication
To fabricate the composite, the TPU is The zylon and carbon fiber are added until there is one homogenous mixture. The material was then dried and cut up into pellet sized pieces to place in the injection molder.

Injection Molder Used
The material is sent into the mold shown below and cooled into 3 inch plugs. It is then cut up into 5-6 mm cylinders with a bandsaw to be subject to testing.
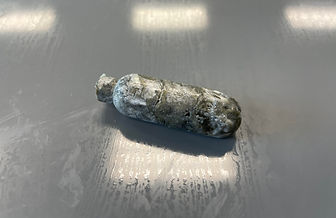

Mold Used
Hardened Plug
Each cut plug is abraded, labeled, measured, and logged. Abrading the plugs reveals the rigid carbon fibers allowing for a higher coefficient of friction.
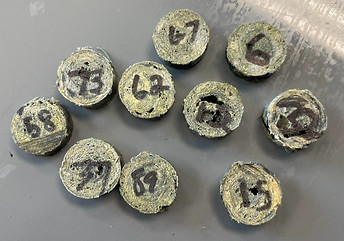
Prepared Plugs

SEM Image of Plug Before Abrasion

DIN Abrasion Tester
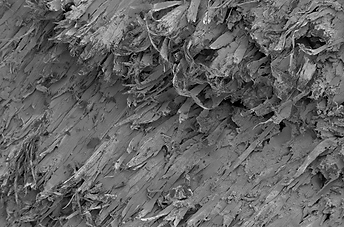
SEM Image of Plug After Abrasion
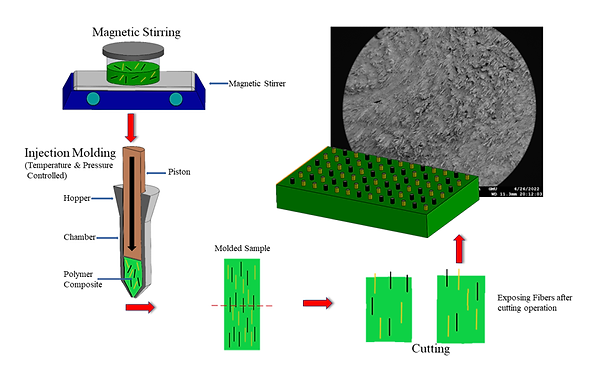
Full Production Process
When logged, each plug has its Abrasion Resistance Index (ARI) calculated which indicates its resistance to wear compared to standard rubber when used on the abrasion tester. It is calculated by the formula below where ΔS1 is the change in mass of rubber, ΔS2 is the change in mass of the sample, d1 is the change in density of rubber, and d2 is the change in density of the sample. Only samples with an ARI above 110 were used.

Abrasion Resistance Index Formula
Experiment Setup and Results
Four different factors were tested at 3 different levels. The factors tested were orientation (direction of fibers), contact area (number of plugs) , location, and edge shape. While there are 81 distinct combinations of factors, utilizing the Taguchi method with a L27 Table allows us to determine the most optimal combination with only 27 combinations. The plugs were glued onto overshoes for testing
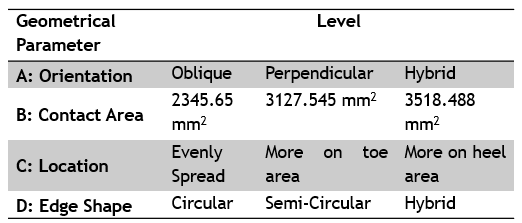
The test used was the Maximum Achievable Angle (MAA) test, established and conducted at the WinterLab at the Toronto Research Institute. A taguchi analysis was conducted on the data collected below and it was found that outsole design with the highest friction had a total surface area of 3518.49 mm^2 (more composite = more friction), an oblique orientation, a combination of both ciruclar and sermi-circular edge shapes, and more plugs towards the heel.

Potential Improvements
One improvement that could be made is better homogenizing the mixture. One solution was dissolving in a mixture of dimethyl formamide (DMF) and tetrahydrofuran (THF) on the magnetic stirrer to better mix the material. It is then placed in a sonic bath for 30 minutes. The material was then dried and cut up into pellet sized pieces in a blender. When injection molded, this batch yielded more usable plugs which would be useful for another set of tests.

Material Before and After Process Improvements
Skills
Injection Molding || Excel || Design of Experiment (DOE)
Results/Lessons Learned
-
Even if testing parameters aren't perfectly equal to what was drawn up, it is more important to keep them consistent to prevent any extra variables during testing.
-
I learned how the Taguchi Method worked and how we can use it to reduce the number of samples needed to test.
-
Documentation and organization was extremely important. There were over 150 samples so keeping track of their ARI and what samples went on which overshoes allowed for any explanations needed from the results.